
Whitburn and Blackburn: How did Reform Win under STV?
by Simon Robinson, 17 Dec 2025
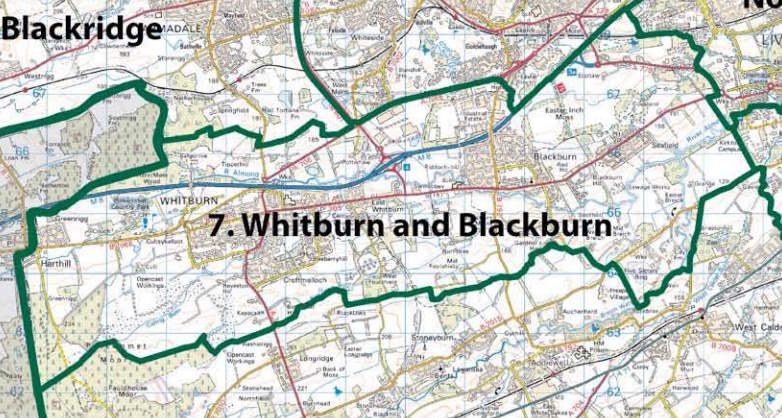
Last week Reform took a seat from Labour in a council by-election in West Lothian: The Whitburn and Blackburn ward, following the resignation of the previous Labour councillor, David Russell.
Now we all know that Reform are riding high in the polls, but even so, they are only on around 30% nationally (and 20% in Scotland), not 50%. Throw in that Reform are very divisive – so it’s a fair guess that most of the 70% nationally (80% in Scotland) who are not voting Reform actively dislike them, and are very unlikely to put them as a 2nd or 3rd preference. So for Reform to get to 50% even on 2nd and 3rd preferences seems very tough. Hence my question in the title, how did Reform Win?
Of course this could have been a local area where they were exceptionally strong, but it seemed worth investigating.
So let’s start with the 1st preference votes:
| Party | Votes | Votes (%) |
|---|---|---|
| Reform UK | 1177 | 32% |
| SNP | 1028 | 28% |
| Labour | 627 | 17% |
| Independent (Thomas Lynch) | 484 | 13% |
| Conservatives | 129 | 4% |
| Liberal Democrats | 102 | 3% |
| Greens | 101 | 4% |
| Independent (Eddie Millar) | 27 | 1% |
| TOTAL | 3675 |
Reform on 32%. So by Scottish standards a good local area for Reform, but still they are nowhere near 50% - not even 1/3 of the votes! Did they really pick up that many 2nd etc. preferences? Let’s take a look.
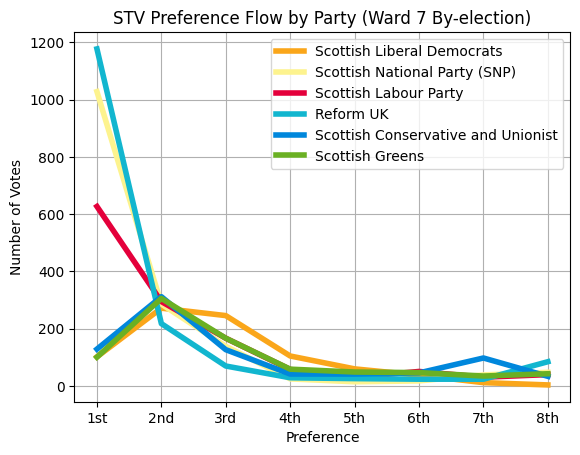
This graph shows the votes at each stage for each party (ignoring the two independent candidates). The way to read it is, for example: Look at the turquoise line for Reform. The peak on the left is how many first preference votes they got. They it drops to 200?, showing how many 2nd preference votes they got, and so on. And similarly for all the other parties.
And my hunch about Reform being divisive was right: Despite being in the lead on 1st preference votes, Reform got significantly fewer 2nd and 3rd preferences than any other party, and basically almost nothing after that. In short, if Reform weren’t your first choice, you were very unlikely to vote for them at all. A sign of how ‘Marmite’ Reform are (voters either love them or hate them) is how Reform’s vote suddenly rose for 8th (that is, last) preferences (8th is last because there were 8 candidates): Reform beat every other party on how many ranked them LAST! Interestingly the Conservatives beat every other party on 7th (second-last) preferences. Presumably quite a few people were putting the Tories 2nd-last then Reform last.
Now compare that with the SNP (the yellow line), who got only slightly fewer 1st preference votes than Reform. The SNP are also quite ‘Marmite’ in Scotland because of the independence question, but picked up significantly more 2nd and 3rd preferences than Reform, showing they are not as divisive in voter’s minds.
On the other hand the LibDems (orange line) took a much lower initial vote share, but we were picking up more 2nd and 3rd and even a noticeable number of 4th preferences. That fits exactly with our positioning as a centrist party that lots of people would be happy to fall back to even if we’re not their first choice.
But back to the original question: How did Reform manage to jump from 32% to 50% when they were getting so few 2nd etc. preference votes? The clue is in this next graph, which shows the the total numbers of votes at each stage (the next graph):
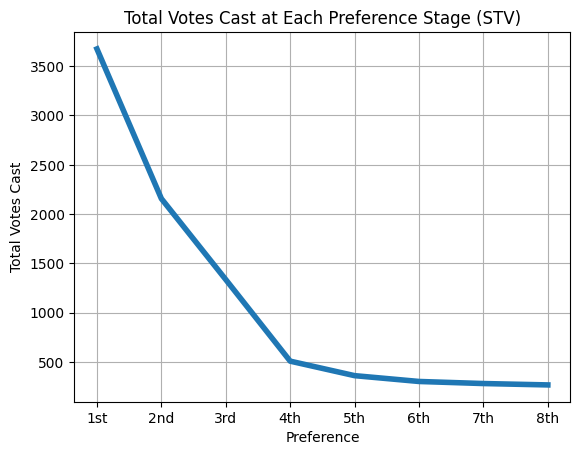
Notice how much the numbers drop. In fact, of the 3675 people who voted, only 2157 even expressed 2nd preferences. Yes, more than 40% of those who voted voted for ONLY one candidate, declining to make any subsequent preferences. And the thing is, if the person you’re voting for gets eliminated due to coming last, and you haven’t marked any alternative preferences, then at that point your vote is simply lost, which means one fewer total votes that the winner has to get 50% of. In fact Reform were finally elected only at the last possible stage – when everyone except Reform and the SNP had been eliminated. At that point the votes looked like this:
| Party | Votes | Votes (%) |
|---|---|---|
| Reform UK | 1411 | 50.4% |
| SNP | 1028 | 49.6% |
| TOTAL | 2798 |
Reform’s tally of 1411 (1177 first preferences plus 234 transfers from other parties) was still only 38% of those who voted, but because so many votes had dropped out due to voters not expressing alternative preferences, that was still enough to push them over 50% of the votes that were left.
I think the lesson there is that, if you are voting in STV or any electoral system that lets you rank candidates, then it really is a good idea to use your preferences – otherwise you’re making it easier for a candidate you really don’t like to get elected.
Sources:
- The detailed by-election results I’ve based this analysis on are at https://www.westlothian.gov.uk/article/87304/Whitburn-and-Blackburn-By-Election-Results-2025.
- The by-election took place on 11 December 2025.
Q: Why can't I comment on this article?
A: I do intend to allow commenting, but this is still a very new website, and I'm still working on coding up support for comments. Be patient 😉...